Goal conversions report
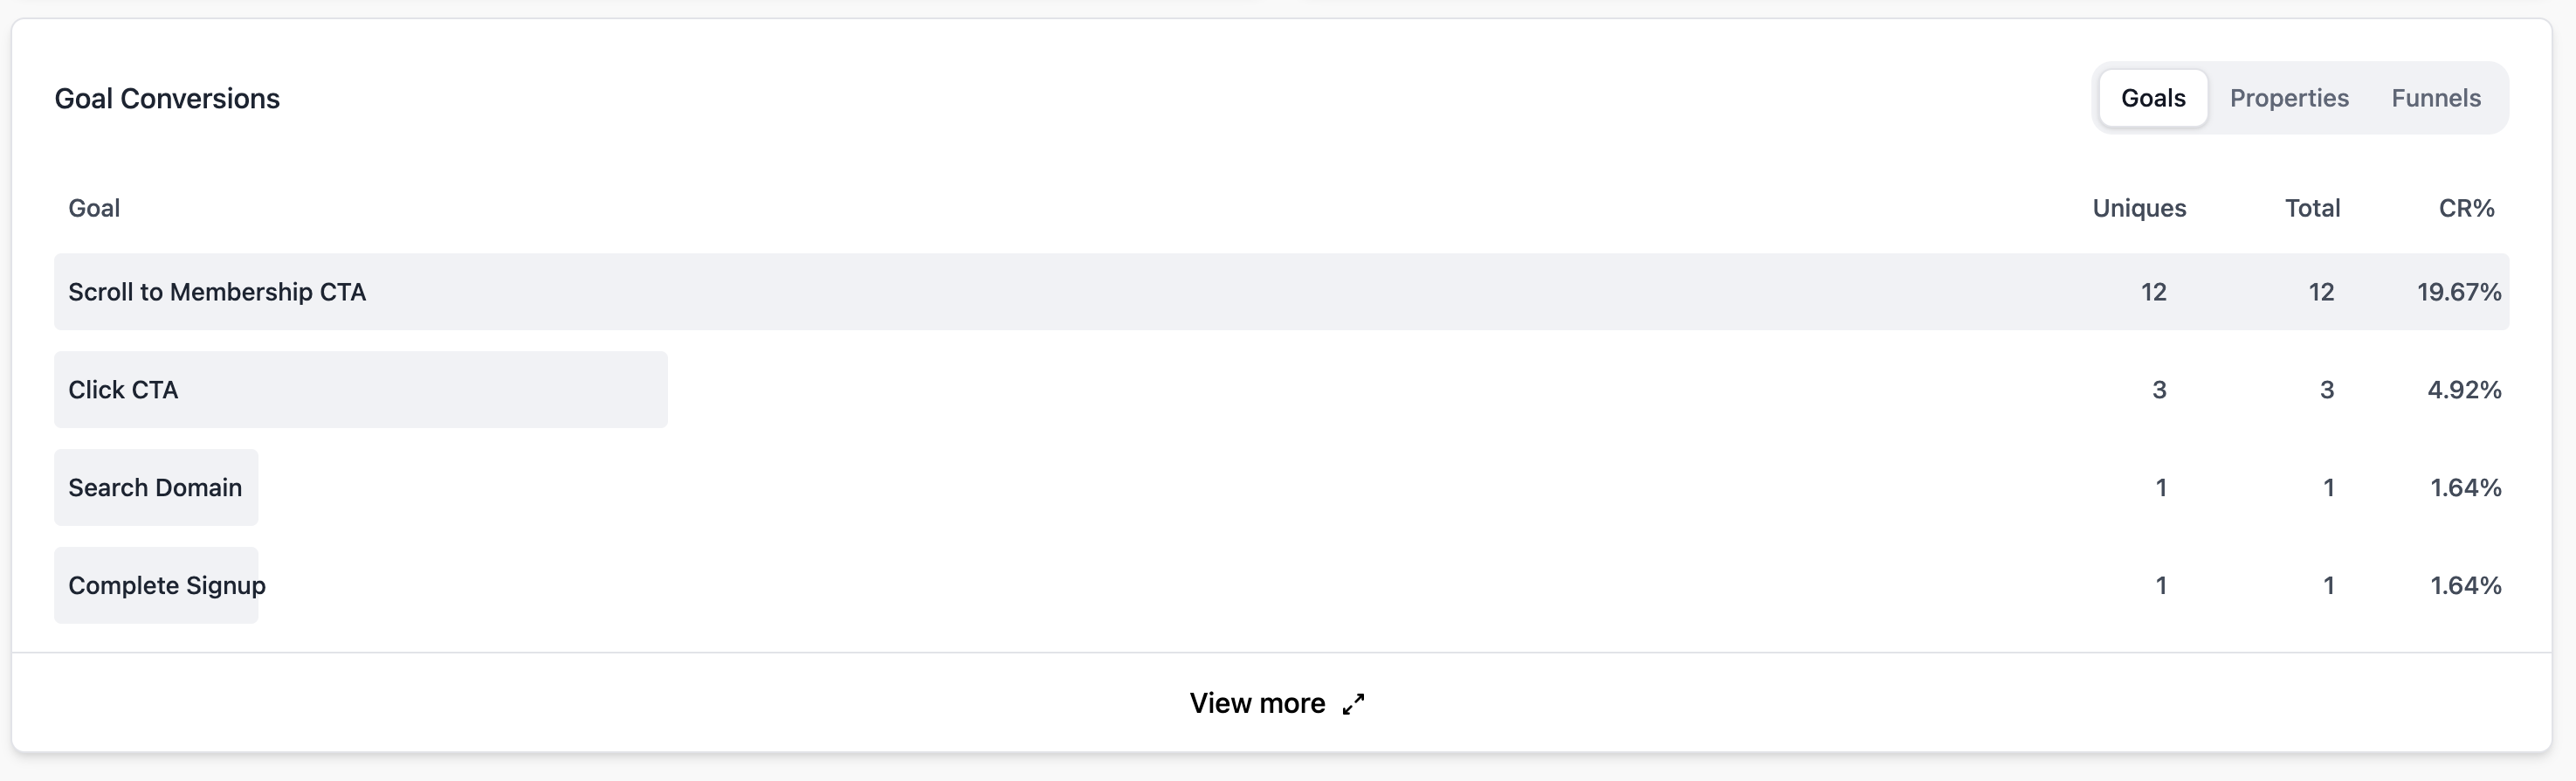
The Goal Conversions report shows how your goals are performing. It appears on your dashboard once you've created at least one goal in your site settings.
Overview
The report lists each of your active goals with the following metrics:
- Total conversions — The total number of times the goal was triggered in the selected period.
- Unique conversions — The number of unique visitors who triggered the goal.
- Conversion rate — The percentage of total visitors who completed the goal.
Goal details
Click on any goal to expand its details. If the goal has custom properties associated with it, you'll see a breakdown of conversions by property value.
For example, if you track a "Sign Up" event with a plan property, clicking the goal will show how many sign-ups came from each plan type.
Conversion chart
The goal conversions section includes a chart showing conversions over time for the selected period. This helps you spot trends and correlate conversions with specific campaigns or events.
Combining with filters
Goal conversion data integrates with all dashboard filters. You can answer questions like:
- Which traffic sources drive the most sign-ups?
- Do mobile visitors convert at a higher rate than desktop visitors?
- Which countries have the highest conversion rates?
Simply apply a filter (click on a source, country, or device) and the goal conversion numbers will update accordingly.
Goal types
Pageviews supports three types of goals, each covered in detail in their own articles:
- Pageview goals — Triggered when a visitor views a specific page.
- Custom event goals — Triggered by JavaScript events you define.
- Scroll depth goals — Triggered when a visitor scrolls past a threshold on a page.