Dashboard overview
The Pageviews dashboard gives you a complete overview of your website traffic in a single, clean interface. It's designed to surface the most important metrics at a glance while allowing you to drill down into the details.
Top-level metrics
At the top of your dashboard, you'll see your key metrics for the selected time period:
- Unique visitors — The number of unique people who visited your site.
- Total pageviews — The total number of pages viewed.
- Bounce rate — The percentage of visitors who didn't meaningfully engage with your site. A visit is considered a bounce if the visitor had no engagement events or spent less than 10 seconds of active time.
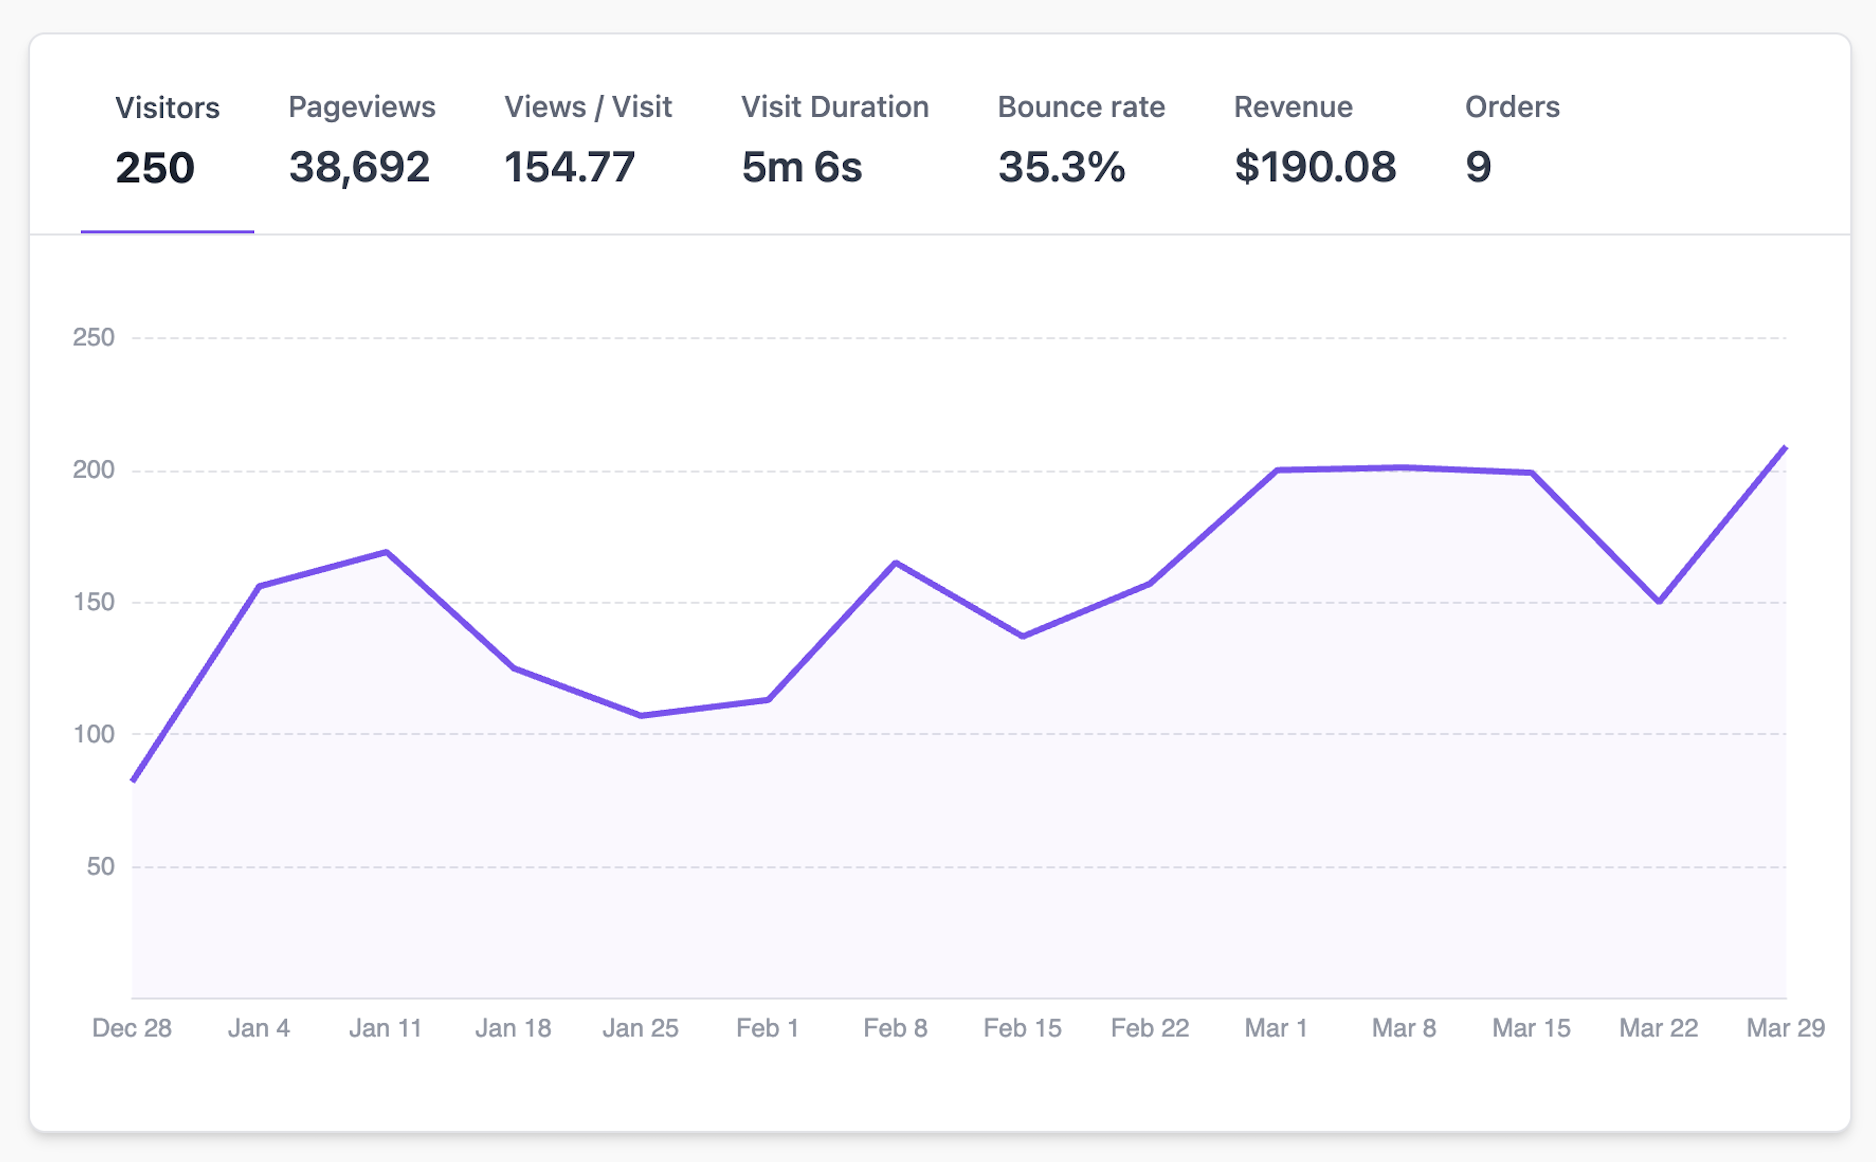
Visits over time
The main chart shows your visitors and pageviews over the selected time period. Hover over any data point to see the exact numbers for that day or hour.
Report sections
Below the chart, your dashboard is divided into several report sections:
- Top Pages — Your most visited pages and their metrics.
- Sources — Where your traffic is coming from (search engines, social media, direct, referrals).
- Countries — Geographic distribution of your visitors.
- Devices — Breakdown by device type, browser, and operating system.
- Goal Conversions — If you've set up goals, their conversion metrics appear here.
Date range
Use the date picker in the top-right corner to change your reporting period. You can select preset ranges (Today, Last 7 days, Last 30 days, etc.) or set a custom date range.
Comparison mode
Click the comparison button next to the date picker to compare your current period with the previous period. This overlays the previous period's data on the chart and shows percentage changes in your metrics.
See the Filtering and comparison article for more details.